

For several years, the fast startup time of an application or service in Java has been a highly discussed topic. According to the authors of numerous articles, it seems if you don’t apply some techniques for a fast startup, your project is doomed.
This is of course nonsense, and I hope that everyone is sensible enough to realise that this is a hype and a sales and marketing trick to sell you some product. Because unless you are working on some project where start-up time is crucial, like financial transactions, the start-up time of 99.9% of the applications is not important at all (within limits).
Moreover, this startup time and topics like microservices and serverless, only focus on architecture and non-functional requirements. And, if the marketing hype is to be believed, it seems that functionality for the user is not important at all anymore – as long as you have an application that uses at least 5 of the current hypes.
Today, I want to add another interesting finding about applications or services focused on fast startup times. As a general rule, the faster your application starts, the less functionality it has.
The test
X starts up faster than Y. When applying Z you can achieve a 30% reduction in start-up time. Some frameworks even made their core marketing tagline based on this. Let us look at 10 solutions and compare them to see what we can learn about the results.
The idea of this test is to develop an application, slightly modified for the requirements of each framework, that has an endpoint capable of processing JSON. As a performance indicator, we measure the time when the first successful response is served by the runtime. I also captured the RSS of the process (for a description see the bottom of the text), to have an idea of the memory usage. And the third parameter I note is the size of the runtime.
Here is a listing of the runtimes:
– Spring Boot 3.0. Project created using Spring Initializr using Spring Reactive web to make use of Netty.
– Quarkus 2.16. Project created using code.quarkus.io using RestEasy Reactive and RestEasy Reactive JSONB.
– Ktor 2.2. Project created using IntelliJ project wizard using Netty server, Content negotiation and Kotlin JSON serialisation.
– HttpServer included in JVM with the addition of Atbash Octopus JSON 1.1.1 for the JSON Binding support. Custom minimal framework for handling requests and sending responses.
– Payara 6. Jakarta EE 10 application running on Payara Micro 6
– OpenLiberty. Jakarta EE 8 application running on OpenLiberty.
– Wildfly 27. Jakarta EE 10 application running on WildFly 27
– Helidon SE 3.1. The project was created using the Helidon Starter and includes JSON-P and JSON-B support.
– Piranha. Jakarta EE 10 core profile application running on the Cor profile distribution
– Micronaut 3.8. The project was created using Micronaut Launch and has support for JSON handling.
Why these 10? Because it is a wide range of frameworks in Java or Kotlin with various features and because it is the list of runtimes that I know well enough to create backend applications in.
The data is gathered when running JDK 17 (Zulu 17.30) on a machine with 16 GB of memory and 8-Core Intel i9 – 2,3 GHz processors. Just to give you all the details of the environment of the test in case you want to repeat the tests.
The determination of the time for the first response is performed by a Python 3 script to make sure we can measure very fast startup times.
All the information and code can be found in the Project FF GitHub repository.
The Results
I will not keep you in suspense any longer, and present you the test results in the table below. The table is sorted according to the first request time from low to high.
| Framework | First Request | RSS | Artefact size |
| Pure Java | 158 ms | 41 Mb | 11 Kb |
| Helidon | 632 ms | 94 Mb | 5.7 Mb |
| Quarkus | 682 ms | 111 Mb | 14.1 Mb |
| Ktor | 757 ms | 111 Mb | 15.3 Mb |
| Micronaut | 956 ms | 116 Mb | 12.2 Mb |
| Piranha | 1060 ms | 140 Mb | 8.7 Mb |
| Spring Boot | 1859 ms | 184 Mb | 21.3 Mb |
| WildFly | 4903 ms | 313 Mb | 63.1 Mb |
| Open Liberty | 6268 ms | 356 Mb | 47.6 Mb |
| Payara Micro | 10018 ms | 438 Mb | 90.1 Mb |
The placement of the frameworks is sometimes surprising, while other known facts are confirmed in this test.
But before I discuss some individual results, I want to highlight another aspect that you can see within the data. And which is actually more important than which framework is a few 100 ms faster.
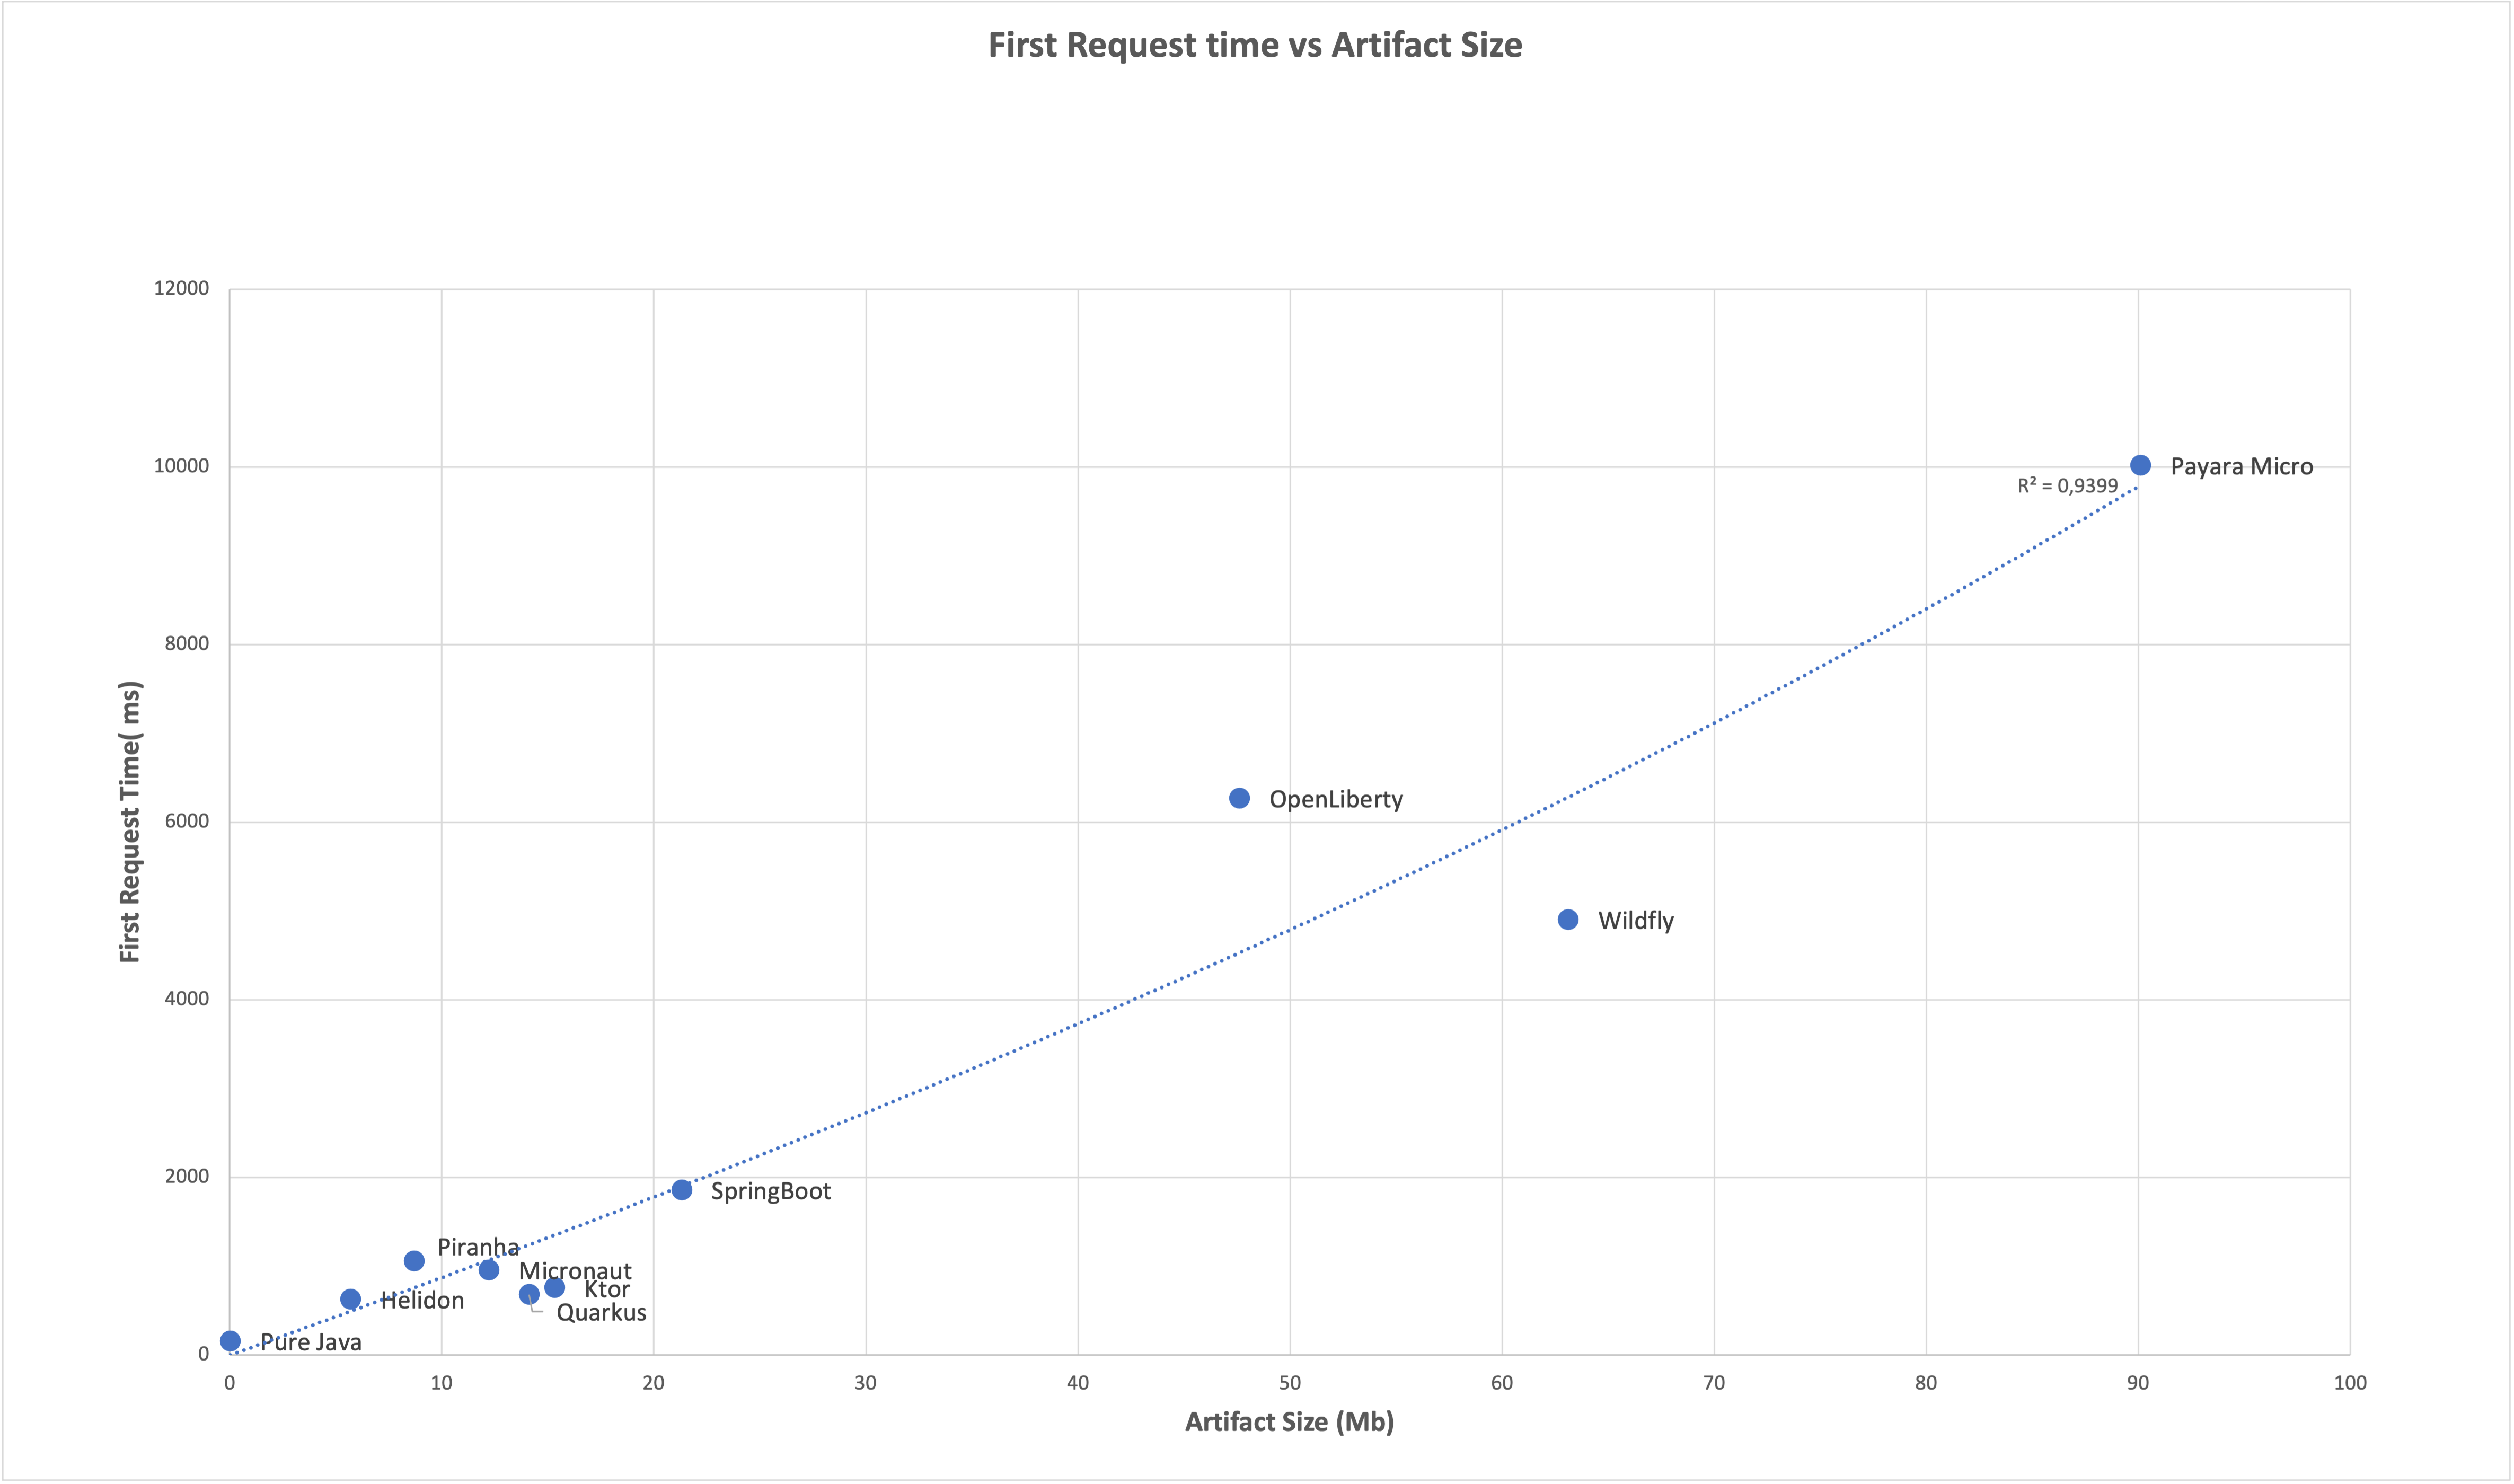
If we plot out the artefact size of the runtime against the first response time, we see a pretty good, almost linear relationship. And that is not really a surprise if you think about it.
No Functionality is a Fast Startup
Looking at the table and the graph in the previous section, it is clear that we can achieve a fast first response when we have little to no functionality available in our application and runtime.
The evidence for that is shown in the example where a simple endpoint is created with only the HttpServer class of the JVM itself and a simple JSON handling library with only the basic functionality. It starts up in an astonishing 158 milliseconds. That is about 25% of the time required by Quarkus, for example.
And the trend of having little code and functionality available which results in a fast startup can also be seen in the results of other frameworks. Really modular frameworks, like Helidon SE, Quarkus, and Ktor are much faster than less modular ones like OpenLiberty and WildFly which are less modular, or Payara Micro which is not modular.
Hence the title “Time is Code, my Friend”, indicates that you can have a faster startup by sacrificing functionality within your application and the runtime, like observability. And yes, native compilation can help here but as said, for 99.9% of applications, startup time is irrelevant. As long as it is reasonably fast – it doesn’t matter if it is 1 or 5 seconds.
But actually, this means that the above results, and the majority of all those other blogs you can read about fast startup times, are completely useless. Do you have an application that just takes in a JSON object and returns a response? Without interaction with any external system like a database or any other data storage, your application will startup fast but will not be very useful.
And another reason why the above results are useless is the environment in which they are executed: a machine with 8 dual-core CPUs. If you allocate that configuration in your cloud provider, you will spend quite a lot of money each month. People hesitate to assign more than 0.5 or 1 CPU to their process which means that startup times must be multiplied by a factor.
So we should perform this kind of performance test in an environment with low CPU power and where the application is accessing databases where latency is also a factor that you should not ignore.
Individual framework discussion
The first observation we can make is that when you really need high performance, do not use any framework or runtime but instead, create your own specialized solution. All the frameworks and runtimes must be generic to support most scenarios developer teams have. This comes with a cost, of course, since developing a specialised solution requires that you have to do much more. It is always a trade-off.
Secondly, Quarkus is less performant in startup time than I expected. They have a very elaborate and complex system to apply build time improvements so that the application can start up really fast. Yet, they reach only the same response times as Helidon SE and Ktor which don’t have such pre-processing. These build time improvements makes Quarkus much more complex, certainly under the hood, which will make maintenance of the framework much harder in the future and requires you to use a Quarkus extension for any kind of library you want to use in combination with Quarkus. There are currently more than 400 extensions because you need a specific extension to make use of the build time enhancements.
Some frameworks start up faster or slower than expected based on the artefact size. Piranha only starts at 1060 ms whereas the trend line says it should start at about 750 ms. So it is 25% slower than expected. Also, OpenLiberty is slower than expected. On the other hand, WildFly, Quarkus, and Ktor are faster.
Atbash Runtime?
I didn’t include the results of Atbash Runtime in the table and the graph. For the simple reason that it is my pet project to learn about many aspects. But here are the results:
| Framework | First Request | RSS | Artefact Size |
| Atbash Runtime | 1537 ms | 168 Mb | 8.2 Mb |
And I’m very proud of the result. Without any efforts focused on the startup time, just trying to create a modular Jakarta EE Core Profile runtime, I succeeded in beating the startup time of Spring Boot. And besides Helidon SE, it is the smallest one.
Conclusion
With the comparison of a simple application looking at the first response time and artefact size using 10 Java and Kotlin frameworks, I want to stress a few important factors:
– All the blogs and articles about startup time are useless since they are based on running a useless application in an unrealistic environment. So we should stop focusing on all these architectural aspects and non-functional requirements and instead, development teams must focus on the things that matter to the end users of the applications!
– Modular runtimes and frameworks help you in removing functionality you do not need. This can help you to keep the startup time fast enough but also introduce some complexity in building and maintaining the artefacts for your environment.
– The build time enhancements of Quarkus make it faster than expected according to the artefact size. But they introduce complexity that can become a problem for the future of the framework. Other solutions like Helidon SE and Ktor achieve the same startup time without these tricks.
– Native compilation (AOT, Graal VM, etc…) can reduce startup time and memory usage but are useless for 99.9% of the applications as they don’t benefit from those gains. And it will only introduce more complexity.
( I would like to thank Debbie for reviewing and commenting on the article)
Notes
The RSS (Resident Set Size) of a process is the portion of its memory that is held in RAM (Random Access Memory) and is used by the operating system to keep track of the memory usage of the process. It includes both the data and code segments of the process, as well as any shared libraries it is linked against.
The tests are performed with 10 times more free memory on the machine to make sure that the process is only using RAM.
Project FF, the Framework Frenzy, Framework Face-off, Framework Fireworks, or … the comparison and similarities between Jakarta EE Web Profile, Spring Boot, Quarkus, Kotlin Ktor, and a few others regarding creating backend applications with REST endpoints. It will host an extensive comparison between many frameworks regarding the functionality that you can find within Jakarta EE Web Profile, MicroProfile, and some other commonly used functionality in today’s back-end applications.
Atbash Training and Support
Do you need a specific training session on Jakarta or MicroProfile? Or do you need some help in getting up and running with your next project? Have a look at the training support that I provide on the page https://www.atbash.be/training/ and contact me for more information.